Overview dashboard
The project was first envisioned four years before the conditions were right for its development.
It brings together information from multiple screens into a unified view, helping users understand the bigger picture while highlighting areas that require deeper investigation.
From Over-kill to edge case designuntill this project came to life we had no massive use in alerting colors on one page. Thats all changed with the new overview. I balance the older type of use in badges and alerting massages from few kinds.
As part of an effort to integrate AI throughout the project lifecycle, I used Claude Design, a newly introduced AI-powered design tool at the time, to support the design process.
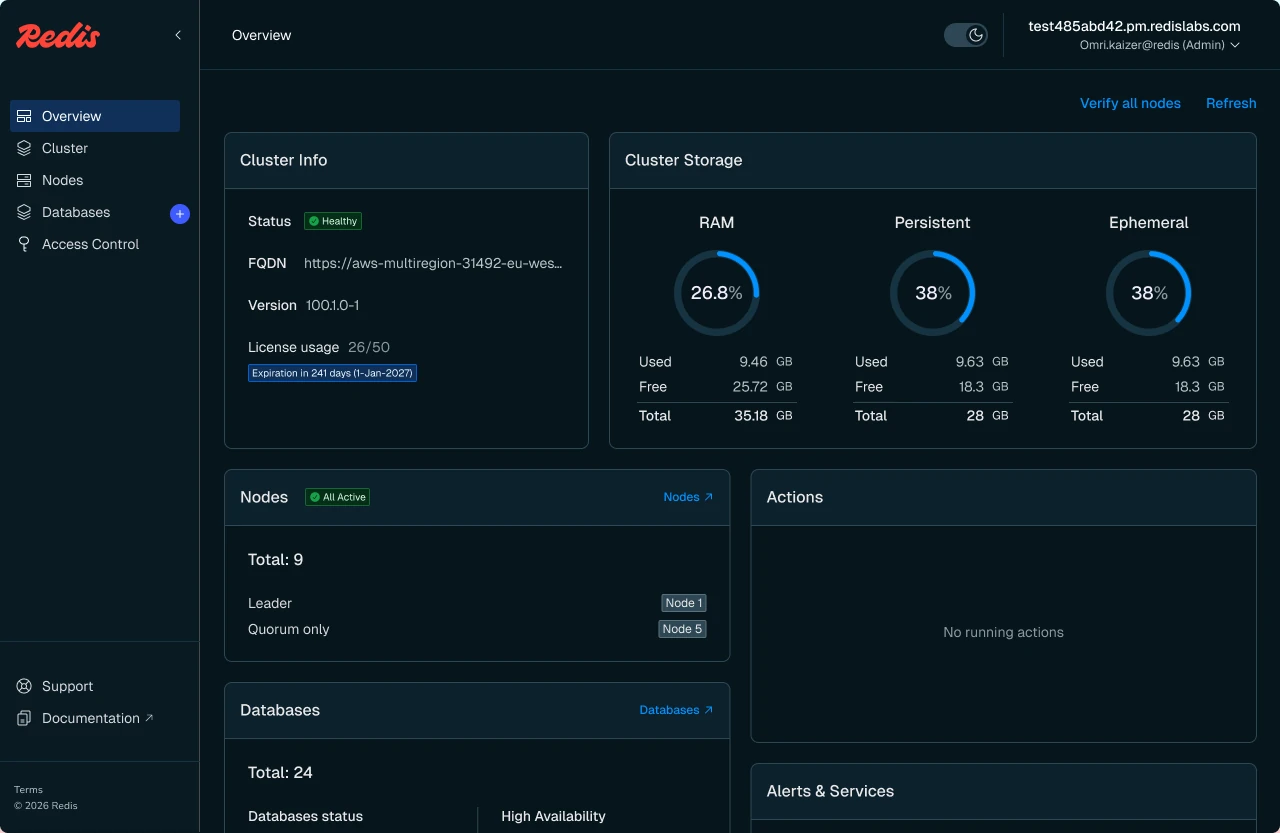
Creating quick access and deep dive into the incidentComplex problems were a pain for our users. The new interface bring a much broader view, allowing the user to get an idea in seconds of the incident
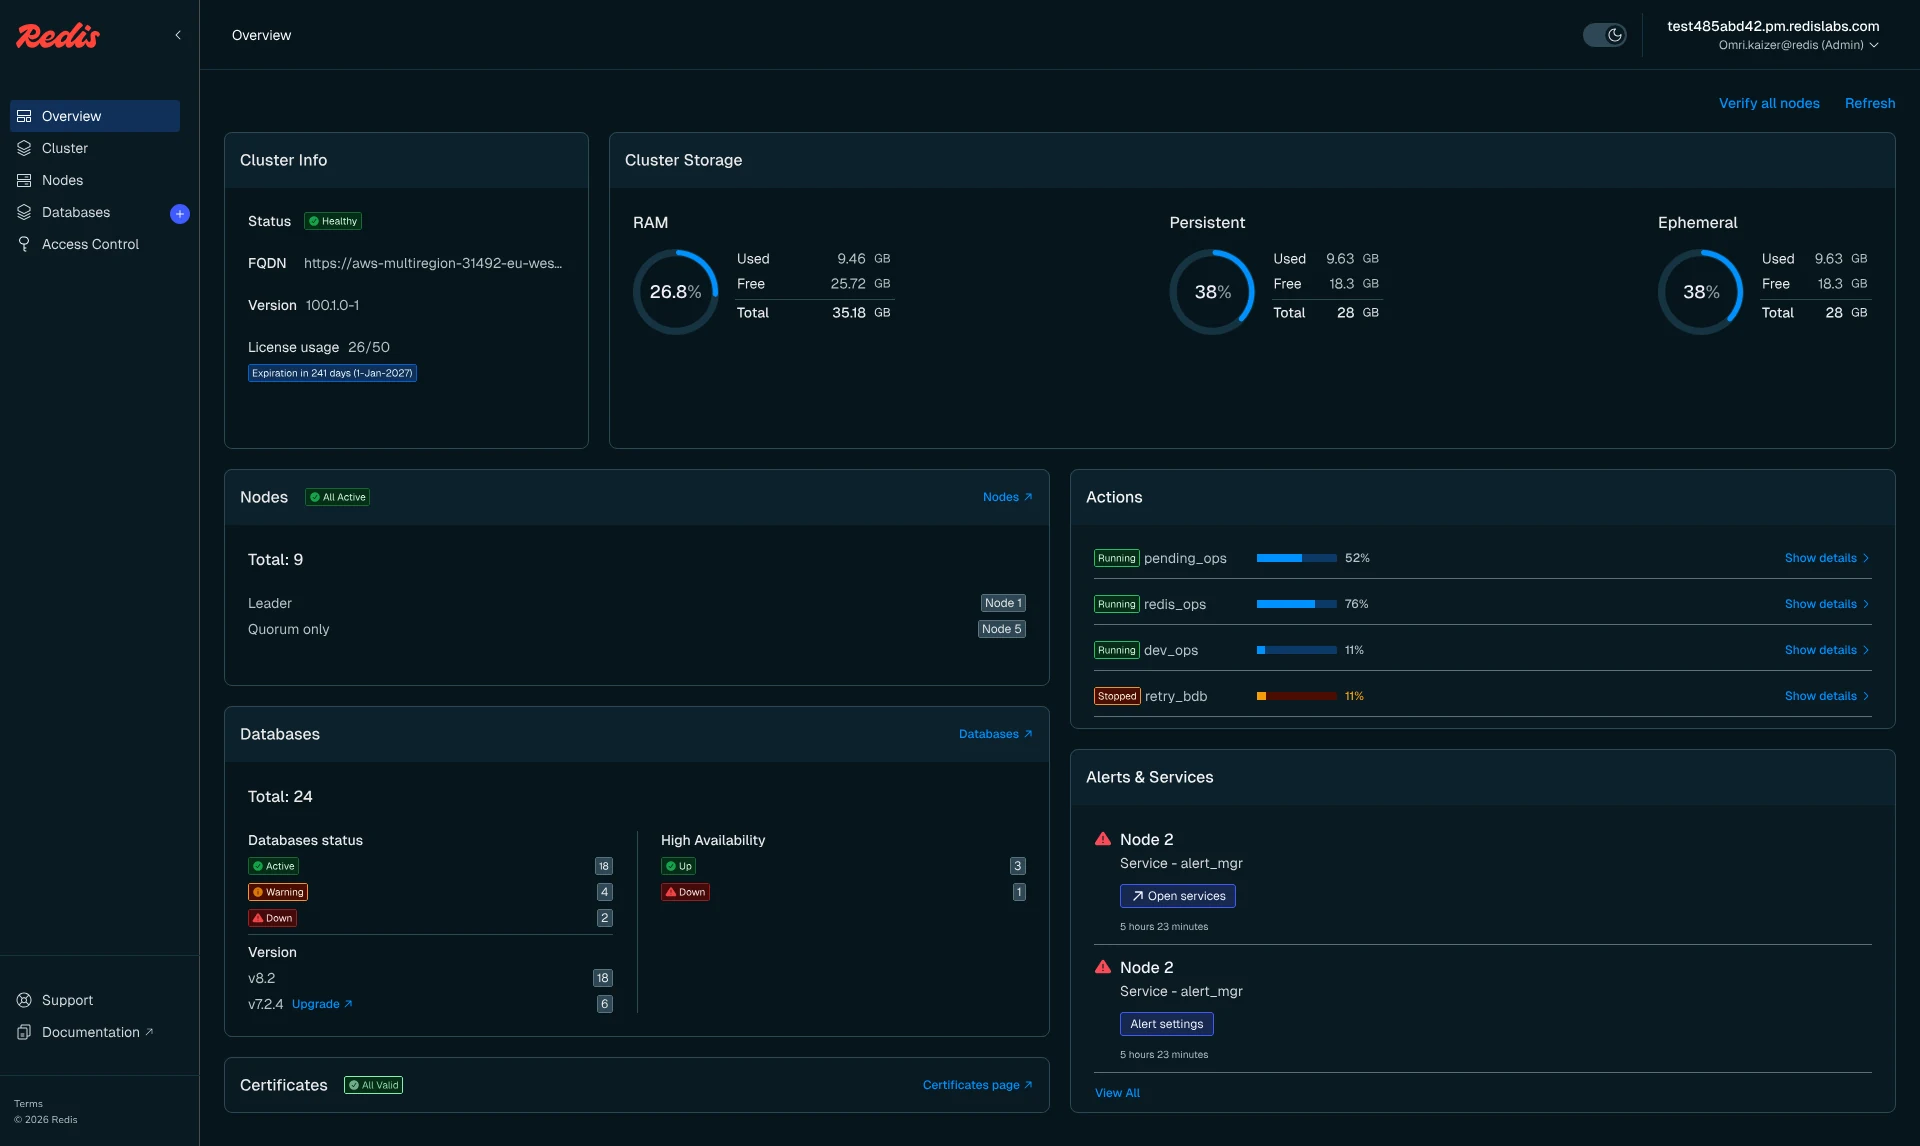
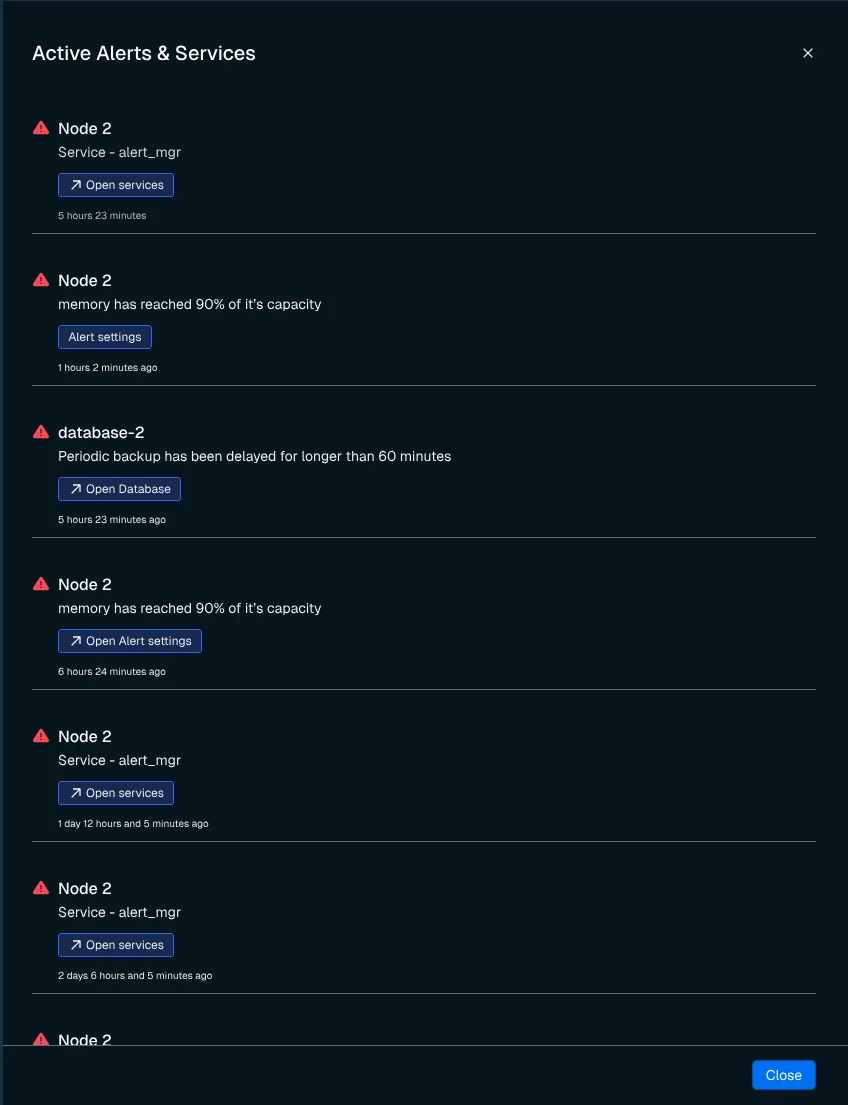
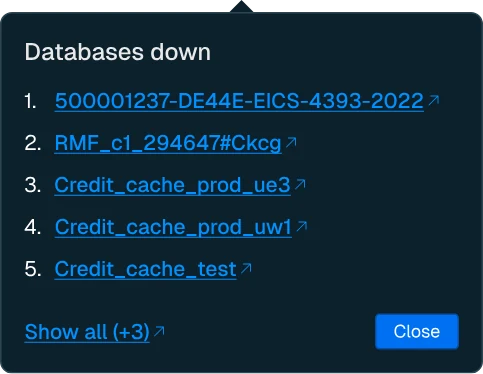
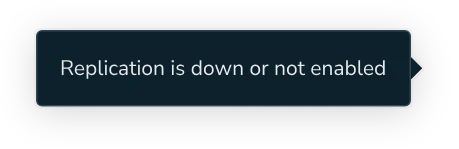
Adjusting components for balanced densityDesigning new variables into design system relevant components.
In some places i had to emphasis visibility while in other balance it down.
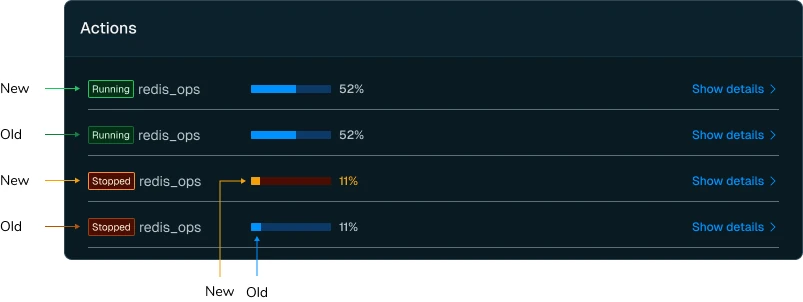
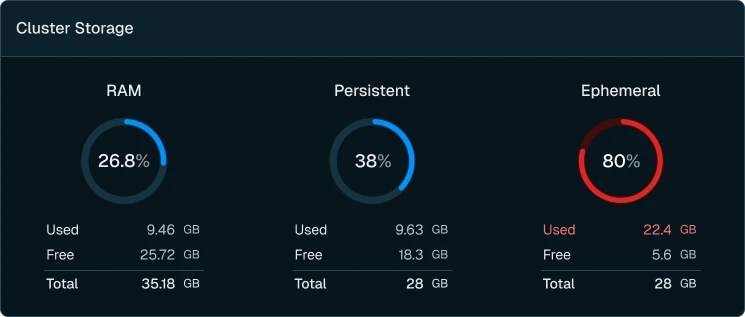
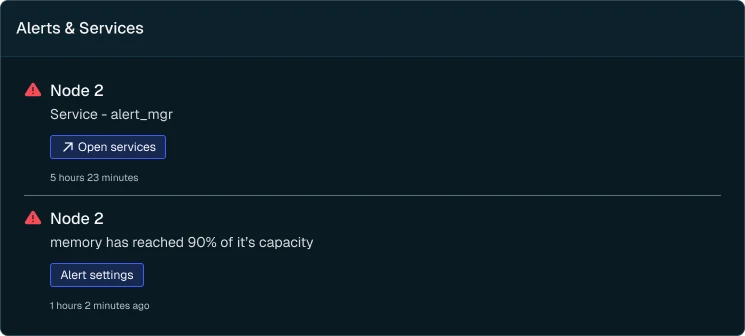
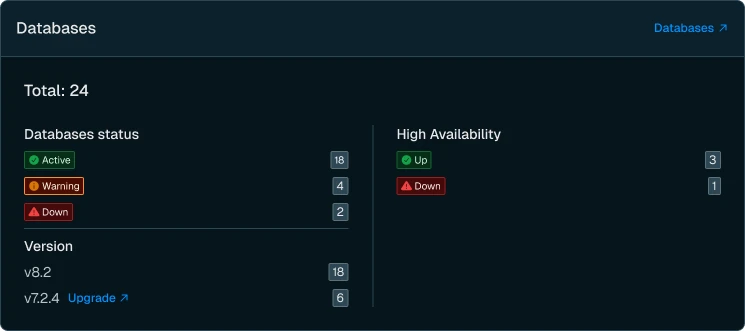
CriticalityUser must understand criticality of each piece in a glance
When Many variations can appear across the dashboard - leveling the criticality was a main goal to achive.
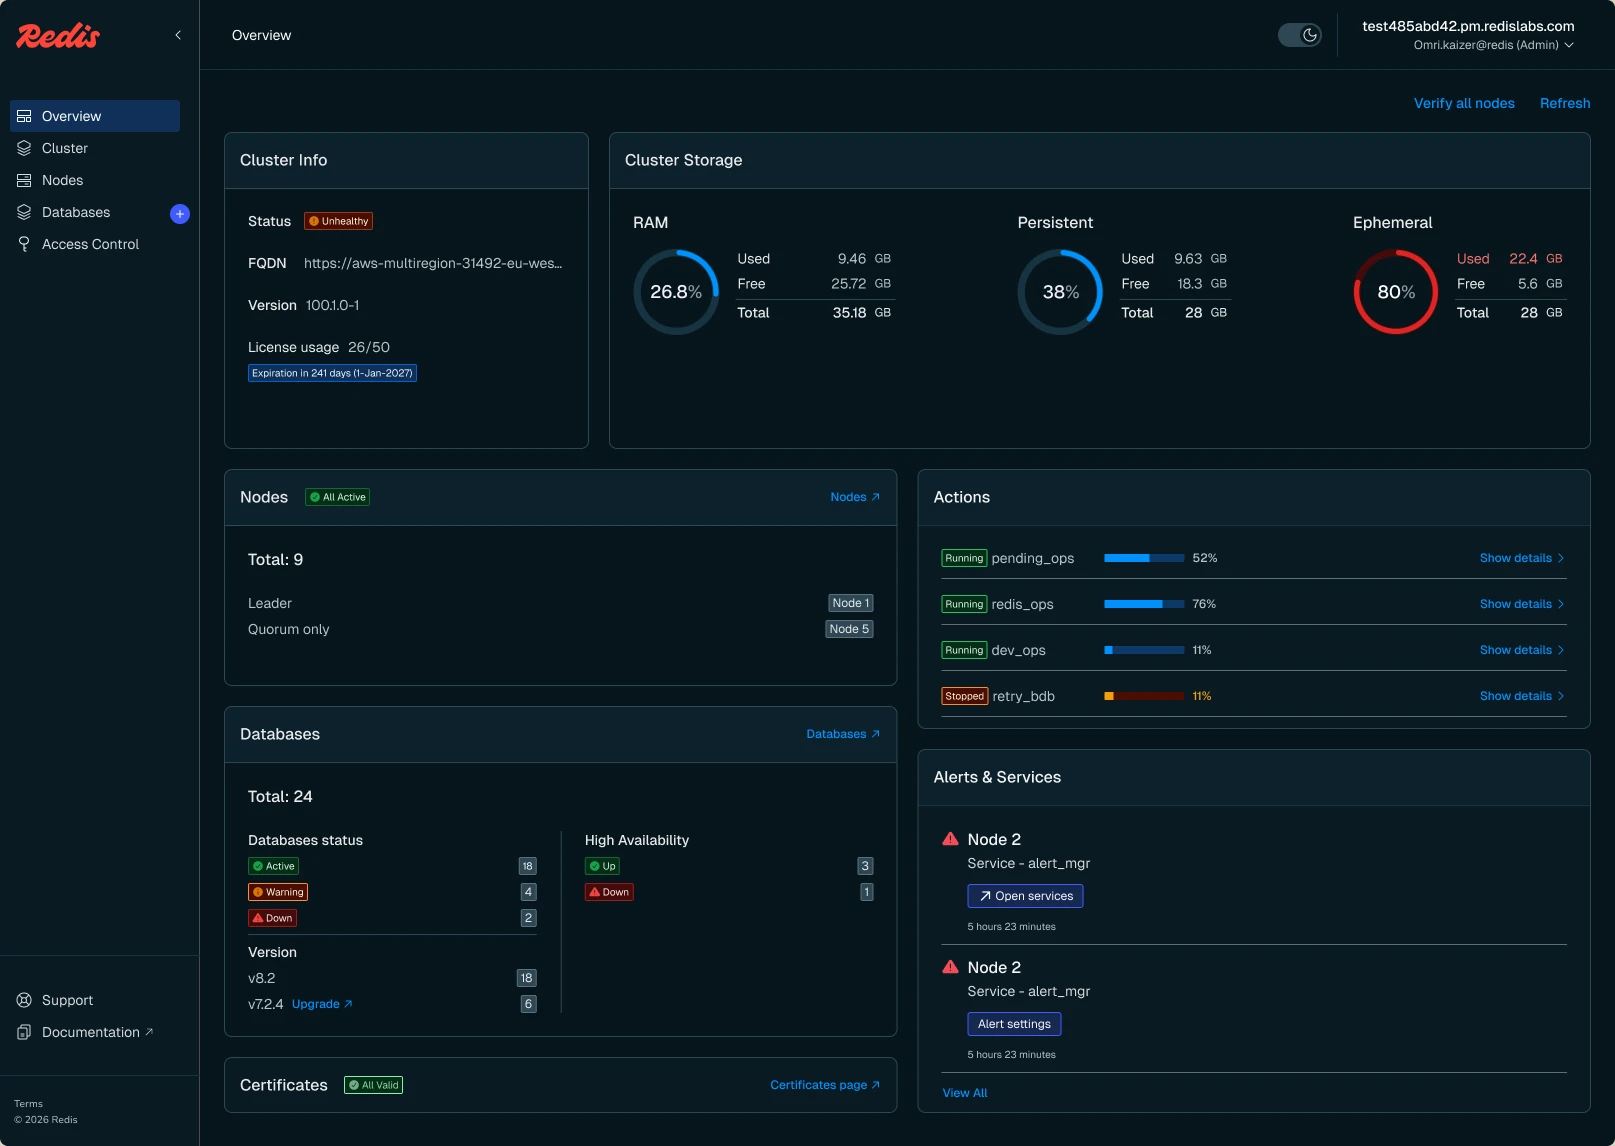
Making organise mess
Since many edge cases combinations are possible, the outcome perform flexible design but balance at once.
This project was design using new component library and without the wire frame step since most of the guidelines were already in use. The focus was on the small details.